样本方差为什么除以N-1?(翻译)
原文作者:Vincent Spruy
译者:程明波
译者注:由于历史原因,高斯分布(Gaussian Distribution),正态分布(Normal Distribution)皆指概率密度函数形如\(\frac{1}{\sqrt{2\pi}\sigma}e^{-\frac{(x-\mu)^2}{2\sigma^2}}\)的分布。文中我会采用正态分布的提法。
简介
本文,呼应标题,我将推导著名正态分布数据均值和方差的计算公式。如果一些读者对于这个问题的“为什么”并不感兴趣,仅仅是对“什么时候使用”感兴趣,那答案就非常简单了:
如果你想预估一份数据的均值和方差(典型情况),那么方差公式除的是\(N-1\),即:
\[\sigma^2 = \frac{1}{N-1}\sum_{i=1}^N (x_i - \mu)^2\]
另一种情况,如果整体的真实均值已知,那么方差公式除的就是\(N\),即:
\[\sigma^2 = \frac{1}{N}\sum_{i=1}^N (x_i - \mu)^2\]
然而,前一种情况,会是你遇到更典型的情形。一会儿,我会举一个预估高斯白噪音的离散程度例子。例子中高斯白噪音的均值是已知的0,这种情况下,我们只需要估计方差。
如果数据是正态分布,我们可以完全用均值\(\mu\)和方差\(\sigma^2\)刻画这个分布。其中,方差是标准差\(\sigma\)的平方,标准差代表了每个数据点偏离均值点的平均距离,也就是说,方差表示了数据离散程度。对于正态分布,68.3%的数据的值会介于\(\mu-\sigma\)和\(\mu+\sigma\)之间。下面图片展示是一个正态分布的概率密度函数,他的均值是\(\mu=10\),方差是\(\sigma^2=3^2=9\):
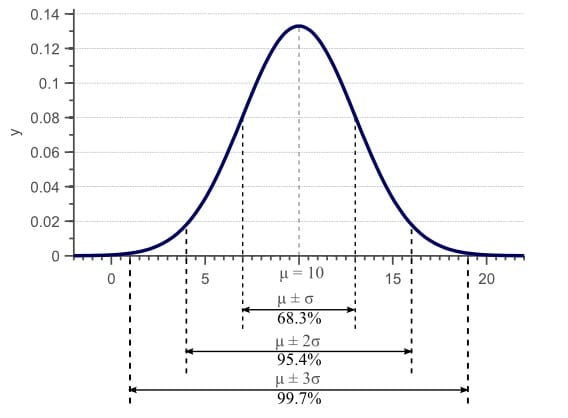
图1. 正态分布概率密度函数. 对于正态分布数据,68%的样本落在均值\(\pm\)方差。
通常,我们拿不到全部的全体数据。上面的例子中,典型的情况是我们有一些观察数据,但是,我们没有上图中x轴上所有可能的观察数据。例如我们可能有下面一些观察数据:
表1
| 观察数据ID | 观察值 |
|---|---|
| 观察数据 1 | 10 |
| 观察数据 2 | 12 |
| 观察数据 3 | 7 |
| 观察数据 4 | 5 |
| 观察数据 5 | 11 |
现在如果我们通过把所有值相加并除以观察的次数,得到经验均值:
\[\mu=\frac{10+12+7+5+11}{5}=9\tag{1}\].
通常,我们会假设经验均值接近分布的未知的真实均值,因此,我们可以假设观测数据来自于均值为\(\mu=9\)的正态分布。在这个例子中,分布真实均值是10, 也就是说,经验均值实际上接近于真实均值。
数据的方差计算如下:
\[\begin{aligned}\sigma^2&= \frac{1}{N-1}\sum_{i=1}^N (x_i - \mu)^2\\&= \frac{(10-9)^2+(12-9)^2+(7-9)^2+(5-9)^2+(11-9)^2}{4})\\&= 8.5.\end{aligned}\tag{2}\]
同样,我们一般假设经验方差接近于基于分布真实未知方差。在此例中,真实方差是9,所以,经验方差也是接近于真实方差。
那么我们手上的问题现在就是为什么我们用于计算经验均值和经验方差的公式是正确的。事实上,另一个我们经常用于计算方差的公式是这样定义的:
\[\begin{aligned}\sigma^2 &= \frac{1}{N}\sum_{i=1}^N (x_i - \mu)^2 \\&= \frac{(10-9)^2+(12-9)^2+(7-9)^2+(5-9)^2+(11-9)^2}{4}) \\&= 6.8.\end{aligned}\tag{3}\]
公式(2)和公式(3)的唯一不同是前一个公式除的是\(N-1\),而后一个除的是\(N\)。两个公式都是对的,只是根据不同的场景使用不同的公式。
接下来的部分,我们针对给定一个正态分布的样本集,完成对其未知方差和均值最好估计的完整推导。我们将会看到,一些情况下,方差除的是\(N\),另一些情况除的是\(N-1\)。
用一个公式近似一个参数(均值或方差)叫做估计量。下面,我们定义一个分布的真实但未知的参数为\(\hat{\mu}\)和\(\hat{\sigma}^2\)。而估计量,例如,经验的平均和经验方差,定义为\(\mu\)和\(\sigma^2\)。
为了找到最优的估计量,首先,一个整体均值为\(\mu\)标准差为\(\sigma\)的正态分布,对于特定的观察点\(x_i\),我们需要一个分析相似的表达式。对于一个已知参数的正态分布一般定义为\(N(\mu,\sigma^2)\)。似然函数为:
\[x_i \sim N(\mu,\sigma^2) \Rightarrow P(x_i; \mu,\sigma)=\frac{1}{\sqrt{2\pi\sigma^2}}e^{-\frac{1}{2\sigma^2}(x-\mu)^2}.\tag{4}\]
为了计算均值和方差,显然,我们需要这个分布一个以上的样本。接下来,设\(\vec{x}=(x_1,x_2,\cdots,x_N)\)为包含所有的可用样本的向量(例如:表一中所有的值)。如果所有这些样本统计独立,我们可以写出联合似然函数为所有似然函数的乘积:
\[\begin{aligned}P(\vec{x};\mu,\sigma^2)&=P(x_1,x_2,\cdots,x_n;\mu,\sigma^2)\\&=P(x_1;\mu,\sigma^2)P(x_2;\mu,\sigma^2)\cdots P(x_N;\mu,\sigma^2)\\&=\prod_{i=1}^{N}P(x_i;\mu,\sigma^2)\end{aligned}.\tag{5}\]
把公式(4)代入公式(5),可得出联合概率密度函数的分析表达式:
\[\begin{aligned}P({\vec{x};\mu,\sigma})&=\prod_{i=1}^{N}\frac{1}{\sqrt{2\pi\sigma^2}}e^{-\frac{1}{2\sigma^2}(x_i-\mu)^2}\\&=\frac{1}{(2\pi\sigma^2)^{\frac{N}{2}}}e^{-\frac{1}{2\sigma^2}\sum_{i=1}^{N}(x_i-\mu)^2}\end{aligned}.\tag{6}\]
公式(6)在接下来的部分将非常重要。我们会用它推导关于正态分布著名的估计量均值和方差。
最小方差,无偏估计量
决定一个估计量是不是“好”估计量,首先我们需要定义什么是真正的“好” 估计量。说一个估计量好,依赖于两个度量,叫做其偏差(bias)和方差(variance)(是的,我们要讨论均值估计量的方差,以及方差估计量的方差)。本节将简单的讨论这两个度量。
参数偏差
想象一下,如果我们能拿到全体不同的(互斥)数据子集。类比之前的的例子,假设,除了【表1】中的数据,我们还有完全不同观察结果表2及表3。那么,一个关于均值好的估计量,应该使得这个估计量平均下来等于真实的均值。我们可以接受其中一个自己的经验均值不等于真实均值,但是,一个好的估计量应该保证:对于所有子集均值估计的平均值等于真实均值。这个限制条件用数学化的表示,就是估计量的期望值(Expected Value)应该等于参数值:
\[E(\mu)=\hat{\mu}\qquad E(\sigma^2)=\hat{\sigma}^2.\tag{7}\]
如果满足上面的条件,那么这些估计量就被称之为“无偏估计”。反之,如果上面的条件不满足,这些估计量叫做“有偏的”,也就是说平均来看,他们或者低估或者高估了参数的真实值。
参数方差
无偏估计量保证平均来看,它们估计的值等于真是参数。但是,这并不意味着每次估计是一个好的估计。比如,如果真实均值为10,一个无偏估计量可以估计全体的其中一个子集的均值为50,而另一个均值为-30。期望的估计的值确实是10,也等于真是的参数值,但是,估计量的质量明显依赖每次估计的离散程度。对于全体5个不同子集,一个估计量产生的估计值(10,15,5,12,8)是无偏的和另一个估计量产生的估计值(50,-30,100,-90,20)(译者注:原文作者最后一个是10,我计算换成20,这样均值才是10)。但是第一个估计量的所有估计值明显比第二个估计量的估计值更接近真实值。
因此,一个好的估计量不仅需要有低偏差,同时也需要低方差。这个方差表示为平均平方误差的估计量:
\[Var(\mu)=E[(\hat{\mu}-\mu)^2]\]
\[Var(\sigma^2)=E[(\hat{\sigma}-\sigma)^2]\]
因此一个好的估计量是低偏差,低方差的。如果存在最优的估计量,那么这个估计应该是无偏的,而且方差比所有的其他可能估计量都要低。这样的一个估计量被称之为最小方差,无偏(MVU)估计量。下一节,我们将会针对一个正态分布推导均值和方差估计量的数学表达式。我们将会看到,一个正态分布的方差MVU估计量在一些假设下需要除以\(N\),而在另一些假设下需要除以\(N-1\)。
最大似然估计
基于整体的一个子集,尽管有大量的获取一个参数估计量的技术,所有这些技术中最简单的可能就数最大似然估计了。
观察值\(\vec{x}\)的概率在公式(6)定义为\(P(\vec{x};\mu,\sigma^2)\). 如果我们在此函数中固定\(x\)和\(\sigma^2\),当使\(\vec{x}\)变化时,我们就可以获得图(1)的正态分布。但是,我们也可以固定\(\vec{x}\),使\(\mu\)和(或)\(\sigma^2\)变化。比如,我们可以选择类似前面例子中的\(\vec{x}=(10,12,7,5,11)\)。我们选择固定\(\mu=10\),同时使\(\sigma^2\)变化。图(2)展示了当\(x\)和\(\mu\)固定时,\(\sigma^2\)对于这个分布取不同值的变化曲线:

图 2. 此图表示了似然函数在特定观察数据\(\vec{x}\),下固定\(\mu=10\),\(\sigma^2\)变化曲线。
上图,我们通过固定\(\mu=10\),令\(\sigma^2\)变化计算了\(P(\vec{x};\sigma^2)\)的似然函数。在结果曲线的每一个数据点代表了似然度,观察值\(\vec{x}\)是一个正态分布在参数\(\sigma^2\)下的样本。那么对应最大似然度的参数值最有可能是从我们定义的分布中产生数据的参数。因此,我们能通过找到似然度曲线的最大值决定最优的\(\sigma^2\)。在此例中,最大值在\(\sigma^2=7.8\),这样标准差就是\(\sqrt{(\sigma^2)=2.8}\)。事实上,如果给定\(\mu=10\),通过传统的方法计算,我们会发明方差就是7.8:
\[\frac{(10-10)^2+(12-10)^2+(7-10)^2+(5-10)^2+(11-10)^2}{5}=7.8\]
因此,基于样本数据的方差计算公式只需要简单的通过找到最大的似然函数的最高点。此外,除了固定\(\mu\),我们可以使\(\mu\)和\(\sigma^2\)同时变化。然后找到两个估计量对应在两个维度的似然函数的最大值。
要找一个函数的最大值,也很简单,只需要求导使其等于0。如果想找一个有两个变量函数的最大值,我们需要计算每个变量的偏导,再把两个偏导全部设置为0。接下来,设\(\hat{\mu}_{ML}\)为通过极大似然方法得到的总体均值的最优估计量,设\(\hat{\sigma}^2_ML\)为方差的最优估计量。要最大化似然函数,我们可以简单的计算它的(偏)导数,然后赋值为0,如下:
\[\begin{aligned} &\hat{\mu}_{ML} = \arg\max_\mu P(\vec{x}; \mu, \sigma^2)\\ &\Rightarrow \frac{\partial P(\vec{x}; \mu, \sigma^2)}{\partial \mu} = 0 \end{aligned}\]
及
\[\begin{aligned} &\hat{\sigma}^2_{ML} = \arg\max_{\sigma^2} P(\vec{x}; \mu, \sigma^2)\\ &\Rightarrow \frac{\partial P(\vec{x}; \mu, \sigma^2)}{\partial \sigma^2} = 0 \end{aligned}\]
下一节,我们将利用这个技术得到\(\mu\)和\(\sigma^2\)的MVU估计量。我们考虑两种情形:
第一种情形,我们假设分布的真正的均值\(\hat{\mu}\)是已知的,因此,我们只需要估计方差,那么问题就变成在参数为\(\sigma^2\)的一维的极大似然函数中对应找其最大值。这种情况不经常出现,但是,在实际应用中确实存在。例如,如果我们知道一个信号(比如:一幅图中一个像素的颜色值)本来应该有特定的值,但是,信号被白噪音污染了(均值为0的高斯噪音),这时分布的均值是已知的,我们只需要估计方差。
第二种情形就是处理均值和方差的真实值都不知道的情况。这种情况最常见,这时,我们需要基于样本数据估计均值和方差。
后面我们将看到,每种情形产生不同的MVU估计量。具体来说,第一种情形方差估计量需要除以\(N\)来标准化MVU。而第二种除的是\(N-1\)。
均值已知的方差估计
参数估计
如果分布的均值真实值已知,那么似然函数只有一个参数\(\sigma^2\)。求最大似然估计量也就是解决:
\[\hat{\sigma^2}_{ML}=\arg\max_{\sigma^2} P(\vec{x};\sigma^2).\tag{8}\]
但是,根据公式(6)的定义,如果计算\(P(\vec{x};\sigma^2)\)涉及到计算函数中指数的偏导。事实上,计算对数似然函数比计算似然函数本身的导数要简单的多。因为对数函数是单调递增函数,其最大值取值位置与原似然函数是一样的。因此我们用下面的式子替换:
\[\hat{\sigma}^2_{ML}=\arg\max_{\sigma^2}\log(P(\vec{x};\sigma^2)).\tag{9}\]
下面,我令\(s=\sigma^2\)简化式子。我们通过计算公式(6)的对数的导数赋值为0来最大化对数似然函数:
\[\begin{aligned}&\frac{\partial \log(P(\vec{x};\sigma^2))}{\partial \sigma^2}=0\\&\Leftrightarrow\frac{\partial\log(P(\vec{x};s))}{\partial s}=0\\&\Leftrightarrow\frac{\partial}{\partial s}\log\left(\frac{1}{(2\pi s)^{\frac{N}{2}}}e^{-\frac{1}{2s}\sum_{i=1}^{N}(x_i-\mu)^2} \right)=0\\&\Leftrightarrow\frac{\partial}{\partial s}\log\left(\frac{1}{(2\pi)^{\frac{N}{2}}}\right)+\frac{\partial}{\partial s}\log\left(\frac{1}{\sqrt{s}^\frac{N}{2}}\right)+\frac{\partial}{\partial s} \log\left(e^{-\frac{1}{2s}\sum_{i=1}^{N}(x_i-\mu)^2}\right )=0\\&\Leftrightarrow0+\frac{\partial}{\partial s}\log\left((s)^{-\frac{N}{2}}\right)+\frac{\partial}{\partial s}\left(-\frac{1}{2s}\sum_{i=1}^{N}(x_i-\mu)^2\right)=0\\&\Leftrightarrow -\frac{N}{2}\log (s)+\frac{1}{2 s^2}\sum_{i=1}^{N}(x_i-\mu)^2=0\\&\Leftrightarrow -\frac{N}{2s}+\frac{1}{2s^2}\sum_{i=1}^{N}(x_i-\mu)^2=0\\&\Leftrightarrow \frac{N}{2s^2}\left(-s+\frac{1}{N}\sum_{i=1}^{N}(x_i-\mu)^2\right)=0\\&\Leftrightarrow\frac{N}{2s^2}\left(\frac{1}{N}\sum_{i=1}^{N}(x_i-\mu)^2-s\right)=0\end{aligned}\]
很明显,如果\(N>0\),那么上面等式唯一的解就是:
\[s=\sigma^2=\frac{1}{N}\sum_{i=1}^{N}(x_i-\mu)^2.\tag{10}\]
注意到,实际上\(\hat{\sigma}^2\)的极大似然估计估计量就是传统上一般计算方差的公式。这里标准化因子是\(\frac{1}{N}\).
但是,极大似然估计并不保证得出的是一个无偏估计量。另外,就算得到的估计量是无偏的,极大似然估计也不能保证估计是最小方差,即MVU。因此,我们需要检查公式(10)的的估计量是否是无偏的。
表现评价
我们需要检查公式(7)的等式是否成立,来确定是否公式(10)中的估计量是无偏的。即判断:
\[E(s)=\hat{s}.\]
我们把公式(10)代入到\(E(s)\),计算:
\[\begin{aligned}E[s] &= E \left[\frac{1}{N}\sum_{i=1}^N(x_i - \mu)^2 \right] = \frac{1}{N} \sum_{i=1}^N E \left[(x_i - \mu)^2 \right] = \frac{1}{N} \sum_{i=1}^N E \left[x_i^2 - 2x_i \mu + \mu^2 \right]\\&= \frac{1}{N} \left( N E[x_i^2] -2N \mu E[x_i] + N \mu^2 \right)\\&= \frac{1}{N} \left( N E[x_i^2] -2N \mu^2 + N \mu^2 \right)\\&= \frac{1}{N} \left( N E[x_i^2] -N \mu^2 \right)\end{aligned}\]
另外,真实方差\(\hat{s}\)有一个非常重要的性质为\(\hat{s}=E[x_i^2]-E[x_i]^2\),可变换公式为\(E[x_i^2]=\hat{s}+E[x_i]^2=\hat{s}+\mu^2\)。使用此性质我们可能从上面的公式推出:
\[\begin{aligned}E[s]&=\frac{1}{N}(N E[x_i^2]-N\mu^2)\\&=\frac{1}{N}(N\hat{s}+N\mu^2-N\mu^2)\\&=\frac{1}{N}(N\hat{s})\\&=\hat{s}\end{aligned}\]
满足了公式(7)的条件\(E[s]=\hat s\),因此,我们得到的数据方差\(\hat s\)的统计量是无偏的。此外,因为极大似然估计的如果是一个无偏的估计量,那么也是最小方差(MVU),也就是说,我们得到的估计量比任何一个其他的估计量都大。
因此,在分布真实均值已知的情况下,我们不用除以\(N-1\),而是用除\(N\)计算正态分布的方差。
均值未知的方差估计
参数估计
上一节,分布的真实均值已知,因此,我们只需要估计数据的方差。但是,如果真实的均值未知,我们均值的估计量就也需要计算了。
此外,方差的估计量需要使用均值的估计量。我们会看到,这时,之前我们得到的方差的估计量就不再无偏了。我们一会儿会通过除以N-1,而不是N来稍微的增加方差估计量的值,从而使方差估计无偏。
与之前一样,基于log似然函数,我们用极大似然估计计算两个估计量。首先我们先计算\(\hat\mu\)的极大似然估计量:
\[\begin{aligned}&\frac{\partial \log(P(\vec{x}; s, \mu))}{\partial \mu} = 0\\&\Leftrightarrow \frac{\partial}{\partial \mu} \log \left( \frac{1}{(2 \pi s)^{\frac{N}{2}}} e^{-\frac{1}{2s}\sum_{i=1}^N(x_i - \mu)^2} \right) = 0\\&\Leftrightarrow \frac{\partial}{\partial \mu} \log \left( \frac{1}{(2 \pi)^{\frac{N}{2}}} \right) + \frac{\partial}{\partial \mu} \log \left(e^{-\frac{1}{2s}\sum_{i=1}^N(x_i - \mu)^2} \right) = 0\\&\Leftrightarrow \frac{\partial}{\partial \mu} \left(-\frac{1}{2s}\sum_{i=1}^N(x_i - \mu)^2 \right) = 0\\&\Leftrightarrow -\frac{1}{2s}\frac{\partial}{\partial \mu} \left(\sum_{i=1}^N(x_i - \mu)^2 \right) = 0\\&\Leftrightarrow -\frac{1}{2s} \left(\sum_{i=1}^N -2(x_i - \mu) \right) = 0\\&\Leftrightarrow \frac{1}{s} \left(\sum_{i=1}^N (x_i - \mu) \right) = 0 \\&\Leftrightarrow \frac{N}{s} \left( \frac{1}{N} \sum_{i=1}^N (x_i) - \mu \right) = 0 \end{aligned}\]
显然,如果\(N>0\),那么上面的等式只有一种解:
\[\mu=\frac{1}{N}\sum_{i=1}^{N}x_i.\tag{11}\]
注意到,实际的这是计算一个分布均值的著名公式。虽然我们知道这个公式,但我们现在证明了极大似然估计量估计了一个正态分布未知均值的真实值。现在我们先假定我们之前公式(10)计算的方差\(\hat s\)的估计量仍然是MVU方差估计量。但下一节我们会证明这个估计量已经是有偏的了。
表现评价
我们需要通过检查估计量\(\mu\)对真实\(\hat \mu\)的估计是否无偏来确定公式(7)的条件能否成立:
\[E[\mu]=E\left[\frac{1}{N}\sum_{i=1}^{N}x_i\right]=\frac{1}{N}\sum_{i=1}^N E[x_i]=\frac{1}{N}N E[x_i]=\frac{1}{N} N \hat\mu=\hat\mu.\]
既然\(E[\mu]=\hat\mu\),那么也就是说我们对分布均值的估计量是无偏的。因为极大似然估计可以保证在估计是无偏的情况下得到的是最小方差估计量,所以我们就已经是证明了\(\mu\)是均值的MVU估计量。
现在我们检查基于经验均值\(\mu\),而不是真实均值\(\hat\mu\)的方差估计量\(s\)对真实方差\(\hat s\)的估计身上仍然是无偏的。我们只需要把得到的估计量\(\mu\)带入到之前在公式(10)推导出的公式:
\[\begin{aligned} s &= \sigma^2 = \frac{1}{N}\sum_{i=1}^N(x_i - \mu)^2\\&=\frac{1}{N}\sum_{i=1}^N \left(x_i - \frac{1}{N} \sum_{i=1}^N (x_i) \right)^2\\&=\frac{1}{N}\sum_{i=1}^N \left[x_i^2 - 2 x_i \frac{1}{N} \sum_{i=1}^N (x_i) + \left(\frac{1}{N} \sum_{i=1}^N (x_i) \right)^2 \right]\\&=\frac{\sum_{i=1}^N x_i^2}{N} - \frac{2\sum_{i=1}^N x_i \sum_{i=1}^N x_i}{N^2} + \left(\frac{\sum_{i=1}^N x_i}{N} \right)^2\\&=\frac{\sum_{i=1}^N x_i^2}{N} - \frac{2\sum_{i=1}^N x_i \sum_{i=1}^N x_i}{N^2} + \left(\frac{\sum_{i=1}^N x_i}{N} \right)^2\\&=\frac{\sum_{i=1}^N x_i^2}{N} - \left(\frac{\sum_{i=1}^N x_i}{N} \right)^2\end{aligned}\]
现在我们需要再次检查公式(7)的条件是否成立,来决定估计量是否无偏:
\[\begin{aligned} E[s]&= E \left[ \frac{\sum_{i=1}^N x_i^2}{N} - \left(\frac{\sum_{i=1}^N x_i}{N} \right)^2 \right ]\\&= \frac{\sum_{i=1}^N E[x_i^2]}{N} - \frac{E[(\sum_{i=1}^N x_i)^2]}{N^2} \end{aligned}\]
记得我们在之前用过方差一个非常重要的性质,真实方差\(\hat s\)可以写成\(\hat s = E[x_i^2]-E[x_i]^2\),即,\(E[x_i^2]=\hat s + E[x_i]^2=\hat s +\mu^2\)。利用这个性质我们可以推出:
\[\begin{aligned} E[s] &= \frac{\sum_{i=1}^N E[x_i^2]}{N} - \frac{E[(\sum_{i=1}^N x_i)^2]}{N^2}\\&= s + \mu^2 - \frac{E[(\sum_{i=1}^N x_i)^2]}{N^2}\\&= s + \mu^2 - \frac{E[\sum_{i=1}^N x_i^2 + \sum_i^N \sum_{j\neq i}^N x_i x_j]}{N^2}\\&= s + \mu^2 - \frac{E[N(s+\mu^2) + \sum_i^N \sum_{j\neq i}^N x_i x_j]}{N^2}\\&= s + \mu^2 - \frac{N(s+\mu^2) + \sum_i^N \sum_{j\neq i}^N E[x_i] E[x_j]}{N^2}\\&= s + \mu^2 - \frac{N(s+\mu^2) + N(N-1)\mu^2}{N^2}\\&= s + \mu^2 - \frac{N(s+\mu^2) + N^2\mu^2 -N\mu^2}{N^2}\\&= s + \mu^2 - \frac{s+\mu^2 + N\mu^2 -\mu^2}{N}\\&= s + \mu^2 - \frac{s}{N} - \frac{\mu^2}{N} - \mu^2 + \frac{\mu^2}{N}\\&= s - \frac{s}{N}\\&= s \left( 1 - \frac{1}{N} \right)\\&= s \left(\frac{N-1}{N} \right) \end{aligned}\]
显然\(E[s]\neq\hat s\),上面公式可知分布的方差估计量不再是无偏的了。事实上,平均来看,这个估计量低估了真实方差,比例为\(\frac{N-1}{N}\)。当样本的数量趋于无穷时(\(N\rightarrow\infty\)),这个偏差趋近于0。但是对于小的样本集,这个偏差就意义了,需要被消除。
修正偏差
因为偏差不过是一个因子,我们只需通过对公式(10)的估计量乘以偏差的倒数。这样我们就可以定义一个如下的无偏的估计量\(s\prime\):
\[\begin{aligned} s\prime &= \left ( \frac{N-1}{N} \right )^{-1} s\\s\prime &= \left ( \frac{N-1}{N} \right )^{-1} \frac{1}{N}\sum_{i=1}^N(x_i - \mu)^2\\s\prime &=\left ( \frac{N}{N-1} \right ) \frac{1}{N}\sum_{i=1}^N(x_i - \mu)^2\\s\prime &= \frac{1}{N-1}\sum_{i=1}^N(x_i - \mu)^2\end{aligned}\]
这个估计量现在就是无偏的了,事实上,这个公式与传统计算方差的公式非常像,不同的是除的是\(N-1\)而不是\(N\)。然而,你可能注意到这个估计量不再是最小方差估计量,但是这个估计量是所有无偏估计量中最小方差的一个。如果我们除以\(N\),那么估计量就是有偏的了,如果我们除以\(N-1\),估计量就不是最小方差估计量。但大体来说,一个有偏的估计量要比一个稍高一点方差的估计量要糟糕的多。因此,如果当总体的均值是未知的情况下,方差除的是\(N-1\),而不是\(N\)。
总结
本文,我们推导了如果从分布数据中计算常见的方差和均值公式。此外,我们还证明了在方差估计中,标准化因子在总体均值已知时是\(\frac{1}{N}\),在均值也需要估计时是\(\frac{1}{N-1}\)。
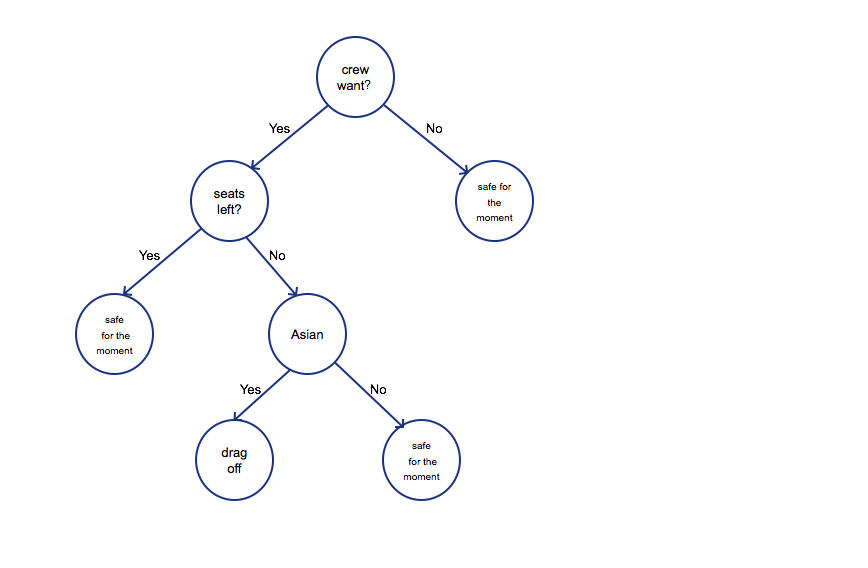 It is a decision tree, which simply represents the procedure of how UA
algorithm make the decision. First of all, before taking off, four
employees of UA need fly from Chicago to Kentucky. Then the algorithm
check if there is any seats left, if so, passengers were safe for the
moment. But UA3411 was full, the algorithm began assessing the
importance of employees or passengers. Obviously, the algorithm think
crew is more important due to business consideration. Then how to choose
who should be evicted from the plane. The algorithm was more complicated
than the tree I drew, however, Asian or not was one of the criterion.
But why? Because Asian are pushovers. The passenger agreed at first,
however, when he heard that he had to wait for one day, he realized that
he could not treat his patient, then he refused. Then he was beat up and
dragged off the plane.


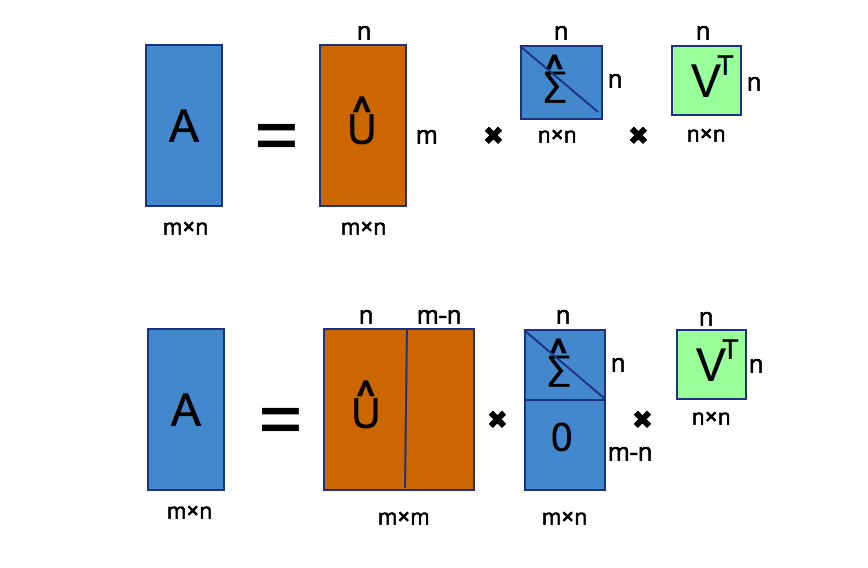
 Here, you can imagine that matrice
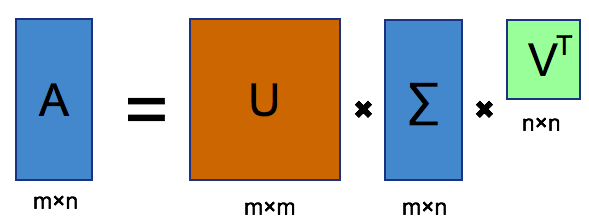 From the picture, we can find that matrice


 Maybe we can search through internet, find all words which are about
advertisment in email. You can restrict that if and only if those which
includes more than 4 word in the list of spam words can be put into
trash can. Maybe finally you can design a rule system to recoginize
those spams without miss important ones. But it seems so boring a job to
do this, moreover, it may be not personalized. If some those who are
working for saling discount stuffs, he/she may find it doesn't work
through applying your effective rules. How about thinking of probablity
of those words emerge in all your inbox. Some words such as "coupon" may
contribute more but not entirety, simultaneously, affordable may
contribute less but not none. Notice that profit emerge in spam emails
and normal emails both sometimes. We let
 If
we contrast this model with logistic regression model, ww find that
right now the to model is just the same: input every
  Look at the figure above, let's look at the definition of Neural
Network, take
 In
fact, we can get a more powerful logic gate through adding more hidden
layers. Only 2 layers of Neural Network can not construct a
  The weights matrices is as followed, we can testify through table
listed.
 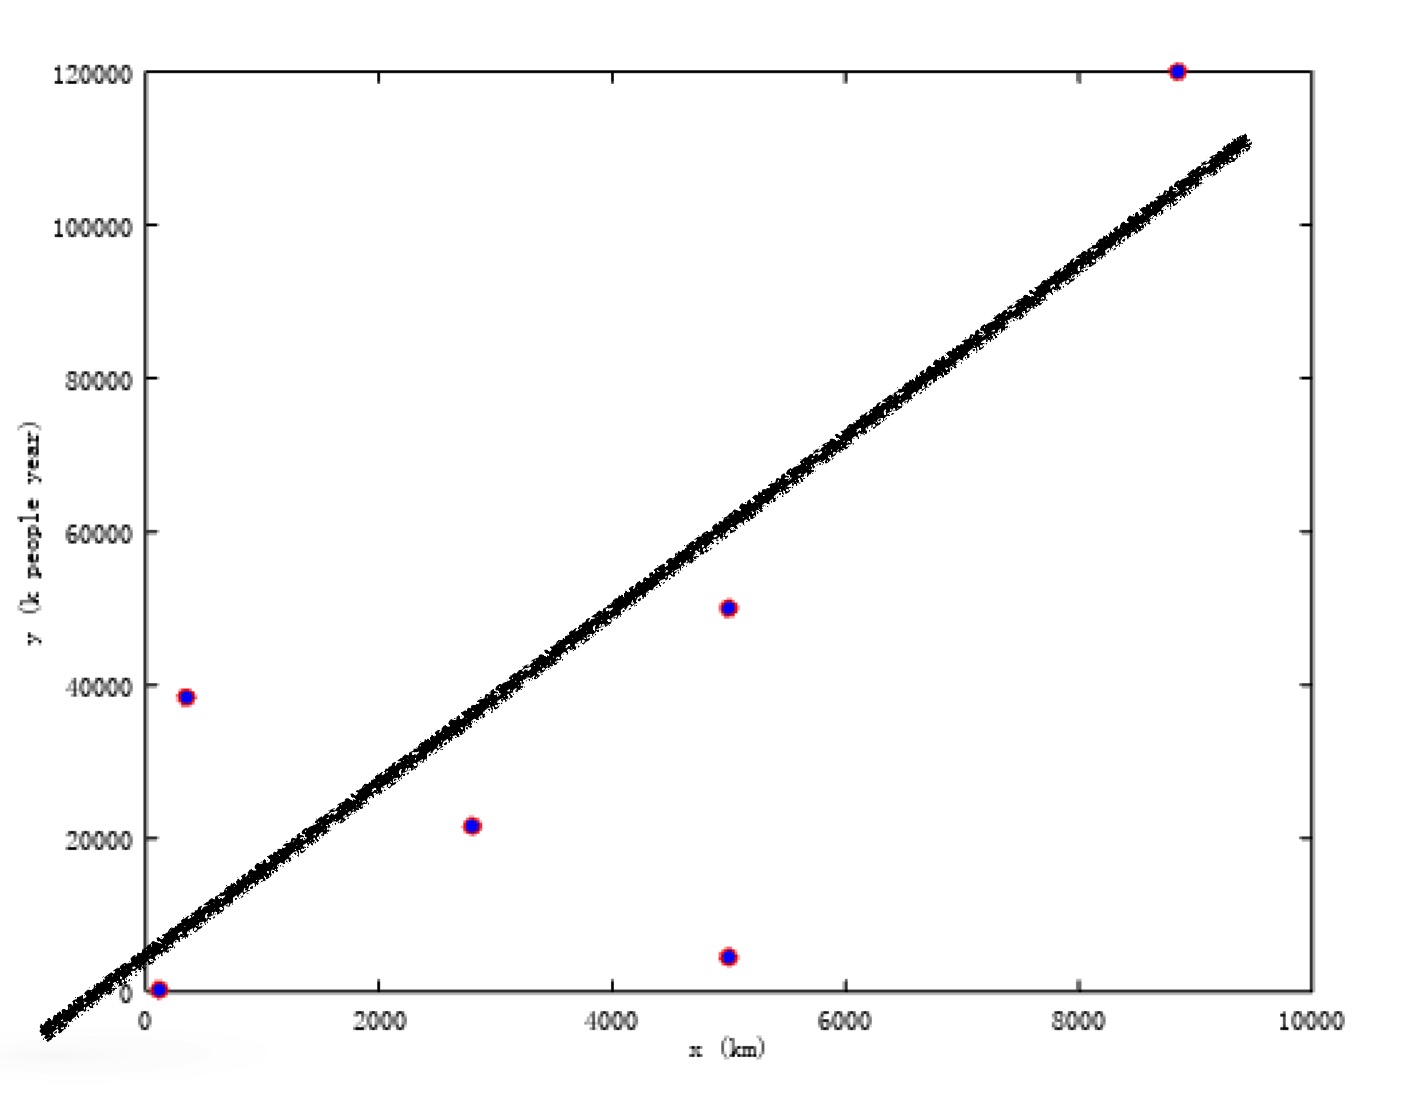 We
hope find a mapping

 What I described is a method named Gradient Descent which is very easy
way to find minima of
